
Built for basketball coaches

Track the action.Coach what comes next.

Record live stats, spot the patterns that matter, and turn every game into a clear plan for what comes next.
  • Live game and player stat tracking
  • Court-based shot analytics
  • Team, player, and game insights
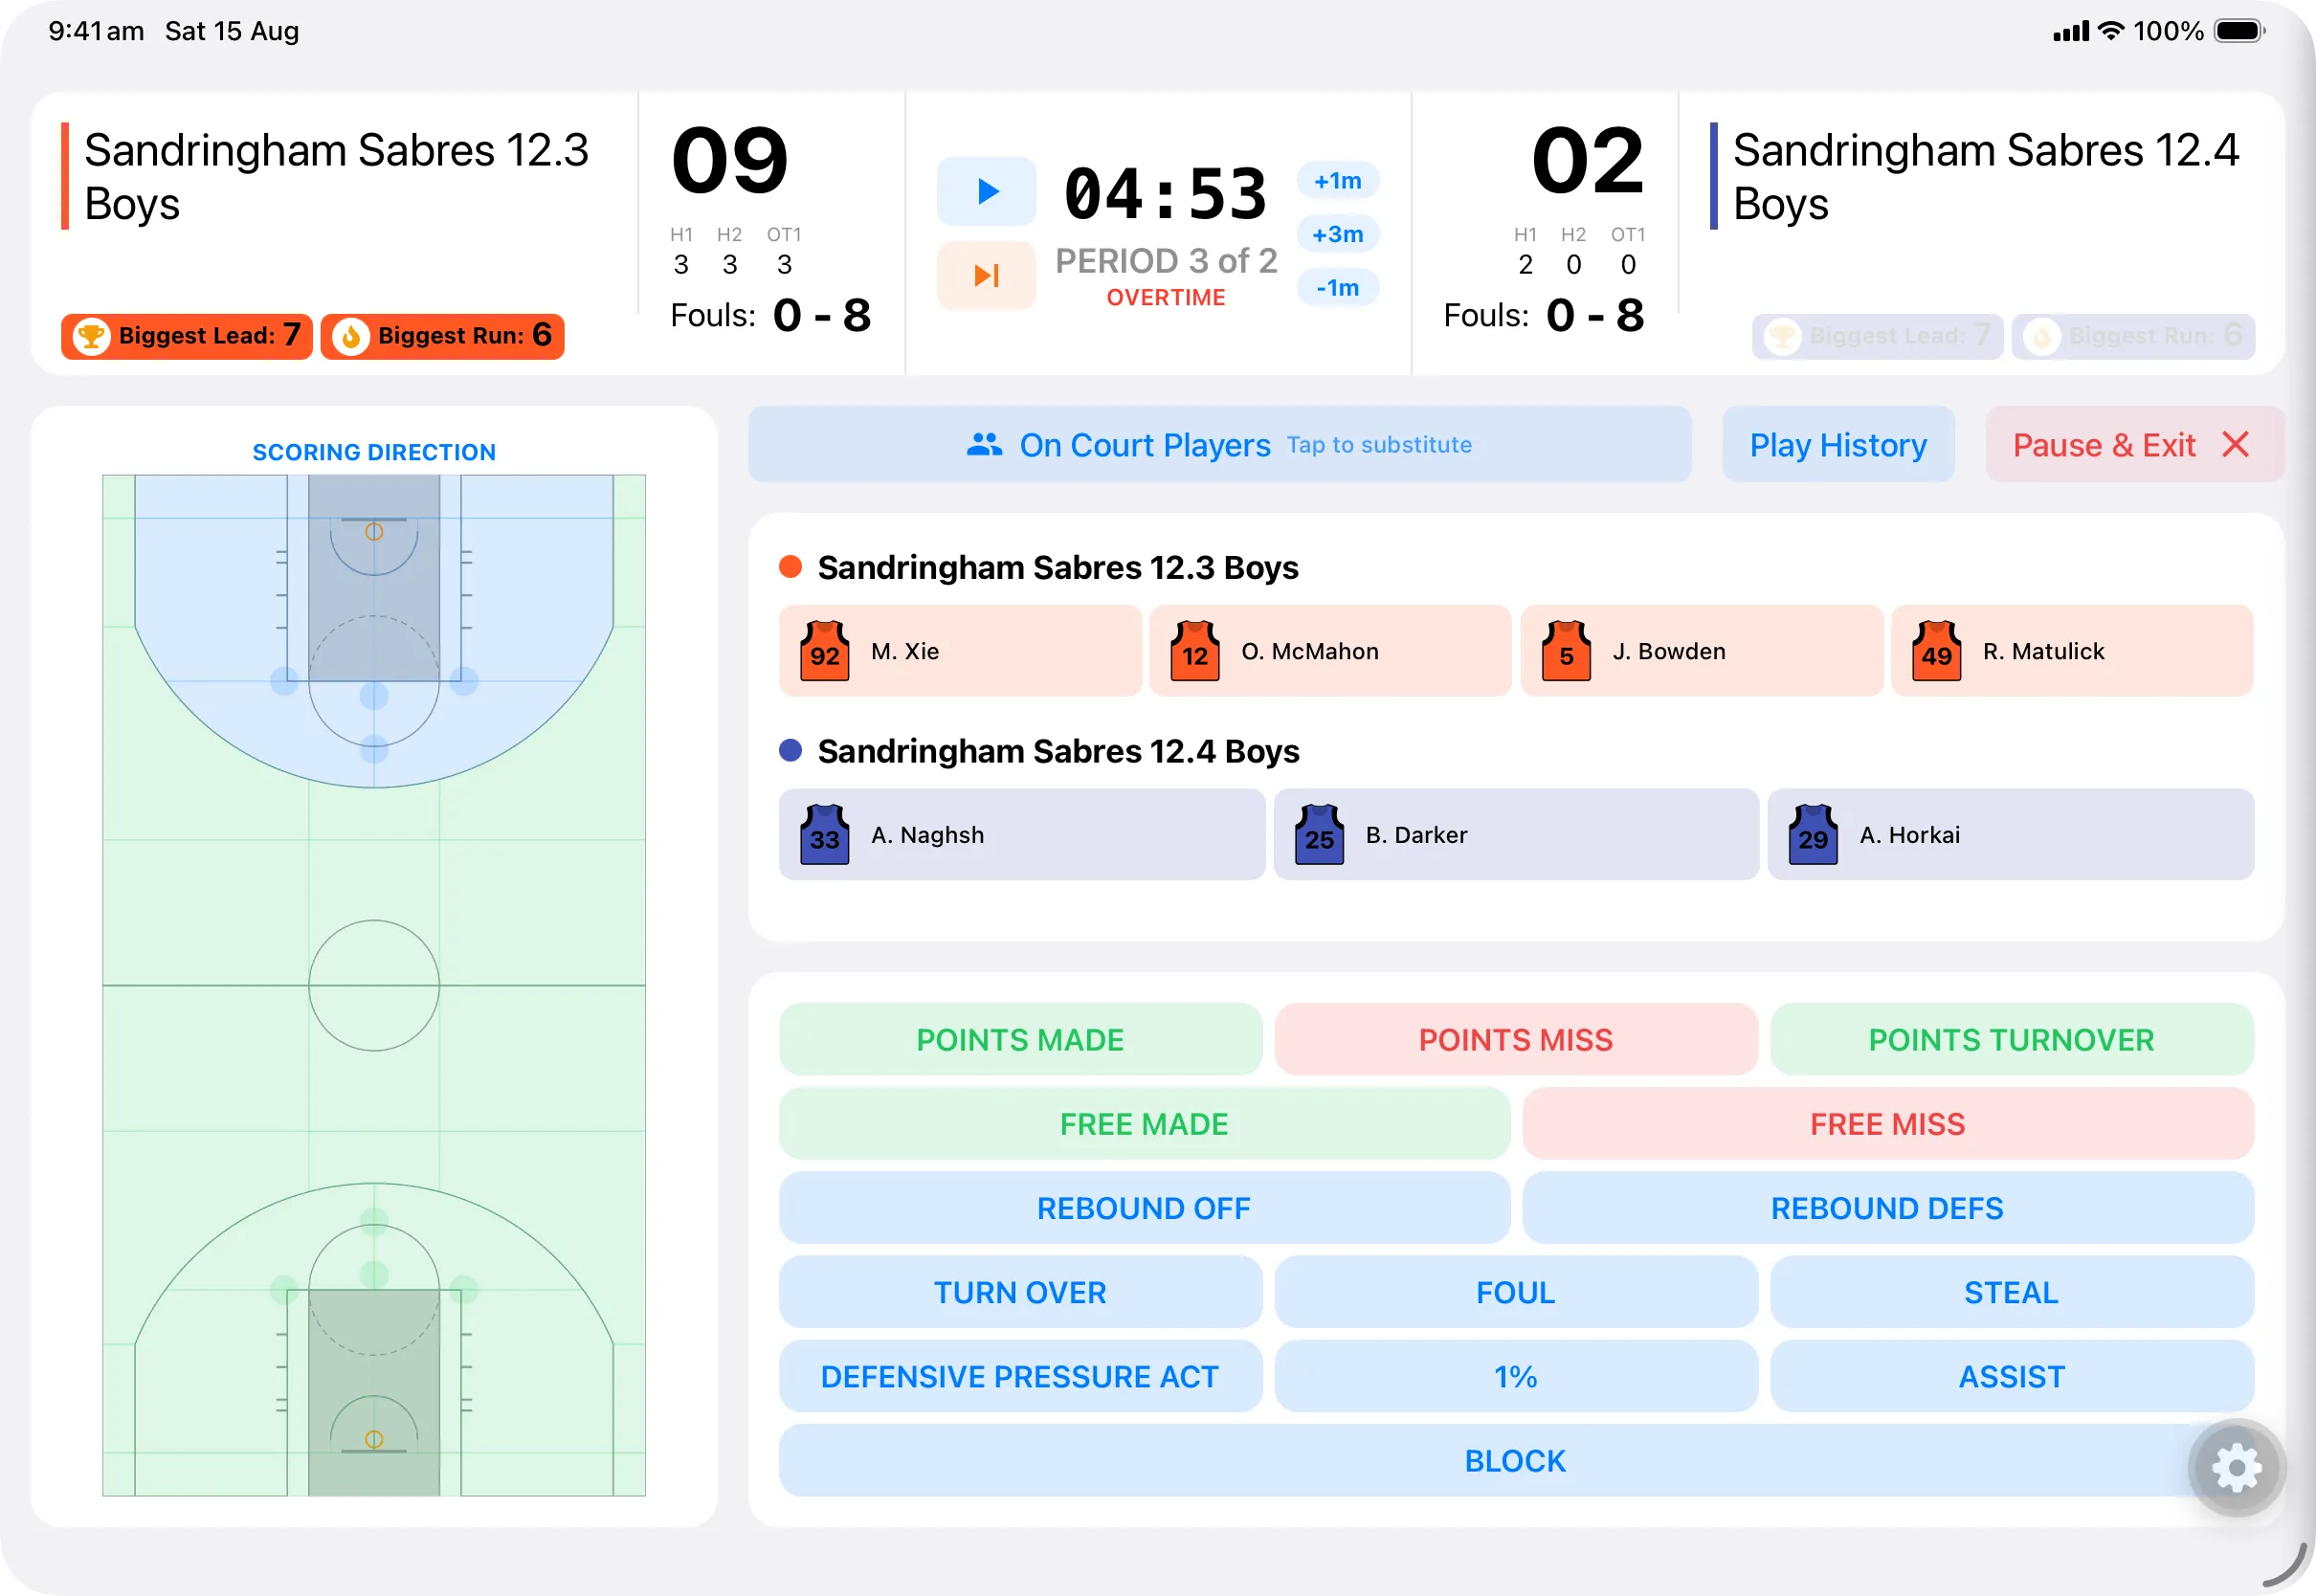
The Dunk Data live game screen on an iPad in landscape. A scoreboard shows both teams, the score, period-by-period scoring, the game clock, the period and team fouls. Below it, a half-court diagram sits beside the on-court players for each team and a panel of stat actions including points made, points missed, points off turnover, free throws, offensive and defensive rebounds, turnover, foul, steal, Defensive Pressure Act, one-percenter, assist and block.

Built for coaches, with the court, clock, periods, substitutions, fouls, and lineups at the centre of every game.

Live. Accurate. Reviewable.

Built for the pace of the game

Record each play from the sideline and keep the score, clock, lineups, and stats together.

Record as it happens

Assign every action to a player, team, court location, and period from one game screen.

Track every shot

Tap where each shot was taken to build a clear picture of your team’s shooting.

Follow every lineup

Keep starters, substitutions, minutes, and plus-minus up to date as the game unfolds.

Fix mistakes

Edit or remove a play at any time and Dunk Data updates the totals for you.

How it works

From sideline actions to coaching decisions

Record the game, find the patterns, and plan what your team works on next.

  1. 1

    Record the game

    Track the scoreboard, game clock, lineups, shots, rebounds, assists, turnovers, fouls, and defensive effort as the game happens.

  2. 2

    Review the game

    Explore box scores, shot zones, game trends, player comparisons, and starting lineups.

  3. 3

    Plan the next step

    Turn your stats into clear coaching points, practice priorities, and next-game goals.

Why it matters

A box score tells you what happened. Dunk Data helps you decide what to do next.

See where shots are working, what causes turnovers and fouls, and how players improve over time. Dunk Data turns those patterns into clear coaching points and practice priorities.

Coaching-oriented
Analysis leads toward actions, cues, and practice planning rather than stopping at charts.
More than a box score
See where shots were taken and what caused turnovers and fouls.
One continuous workflow
Live tracking, game review, longer-term analytics, and coaching guidance are connected.
Metrics you can understand
Each advanced rating includes a clear explanation of what it tells you.
Flexible recording
Each side of a game can use player-level or team-only recording.
Made for basketball
The app is built around the court, game clock, periods, lineups, fouls, and jerseys.

What you get

Record the game, then read it properly

Everything you need to record games, understand performance, and prepare for the next session.

Live game tracking

Built for the speed of live basketball

Keep the game moving while Dunk Data keeps the stats organised. Record each play from one screen while the score, clock, fouls, minutes, substitutions, and plus-minus stay up to date.

  • Configure teams, venue, periods, period length, foul limit, and overtime before tip-off.
  • Choose individual-player or team-only recording independently for each side.
  • Record made and missed two-pointers, three-pointers, and free throws from their court location.
  • Capture rebounds, assists, steals, blocks, turnovers, fouls, Defensive Pressure Acts, and one-percenters.
  • Pause and resume a game, then continue an unfinished game from game management.
The Dunk Data live game screen on an iPad in landscape. A scoreboard shows both teams, the score, period-by-period scoring, the game clock, the period and team fouls. Below it, a half-court diagram sits beside the on-court players for each team and a panel of stat actions including points made, points missed, points off turnover, free throws, offensive and defensive rebounds, turnover, foul, steal, Defensive Pressure Act, one-percenter, assist and block.
The live game screen in landscape, recorded with demo teams and players.

Event history

Keep the context, not just the count

Two turnovers can need different coaching responses. Record what caused each turnover or foul, where it happened, and who was involved. You can review and correct every play after the game.

  • Edit an event’s player, stat type, court location, or classification after the fact.
  • Delete an incorrect event and reverse its effect on related totals.
  • Assign the cause behind points scored off a turnover.
  • Leave a classification unspecified when the detail is genuinely unknown.

Adding a cause gives you more coaching detail without changing the box score.

Turnover types

  • Bad pass
  • Charge
  • Carry
  • Fumbled ball
  • Illegal dribble
  • Inbound violation
  • Excessive dribbling
  • Unspecified

Foul types

  • Reaching
  • Hand checking
  • Illegal screen
  • Blocking
  • Holding
  • Technical
  • Intentional
  • Player control
  • Unspecified

Each recorded turnover or foul can carry one of these classifications, or be left unspecified when the detail is unknown.

Shot Analytics

See the patterns behind the shot profile

See more than makes and misses. Compare shooting by court zone, player, period, shot value, or result to find strengths and weak spots.
  • Switch between an Efficiency view and a Volume view of the same attempts.
  • Read field-goal percentage, makes and attempts, and points-per-shot context per zone.
  • Filter by team, player, period, shot value, and made or missed result.
  • See when a percentage is based on only a small number of shots.
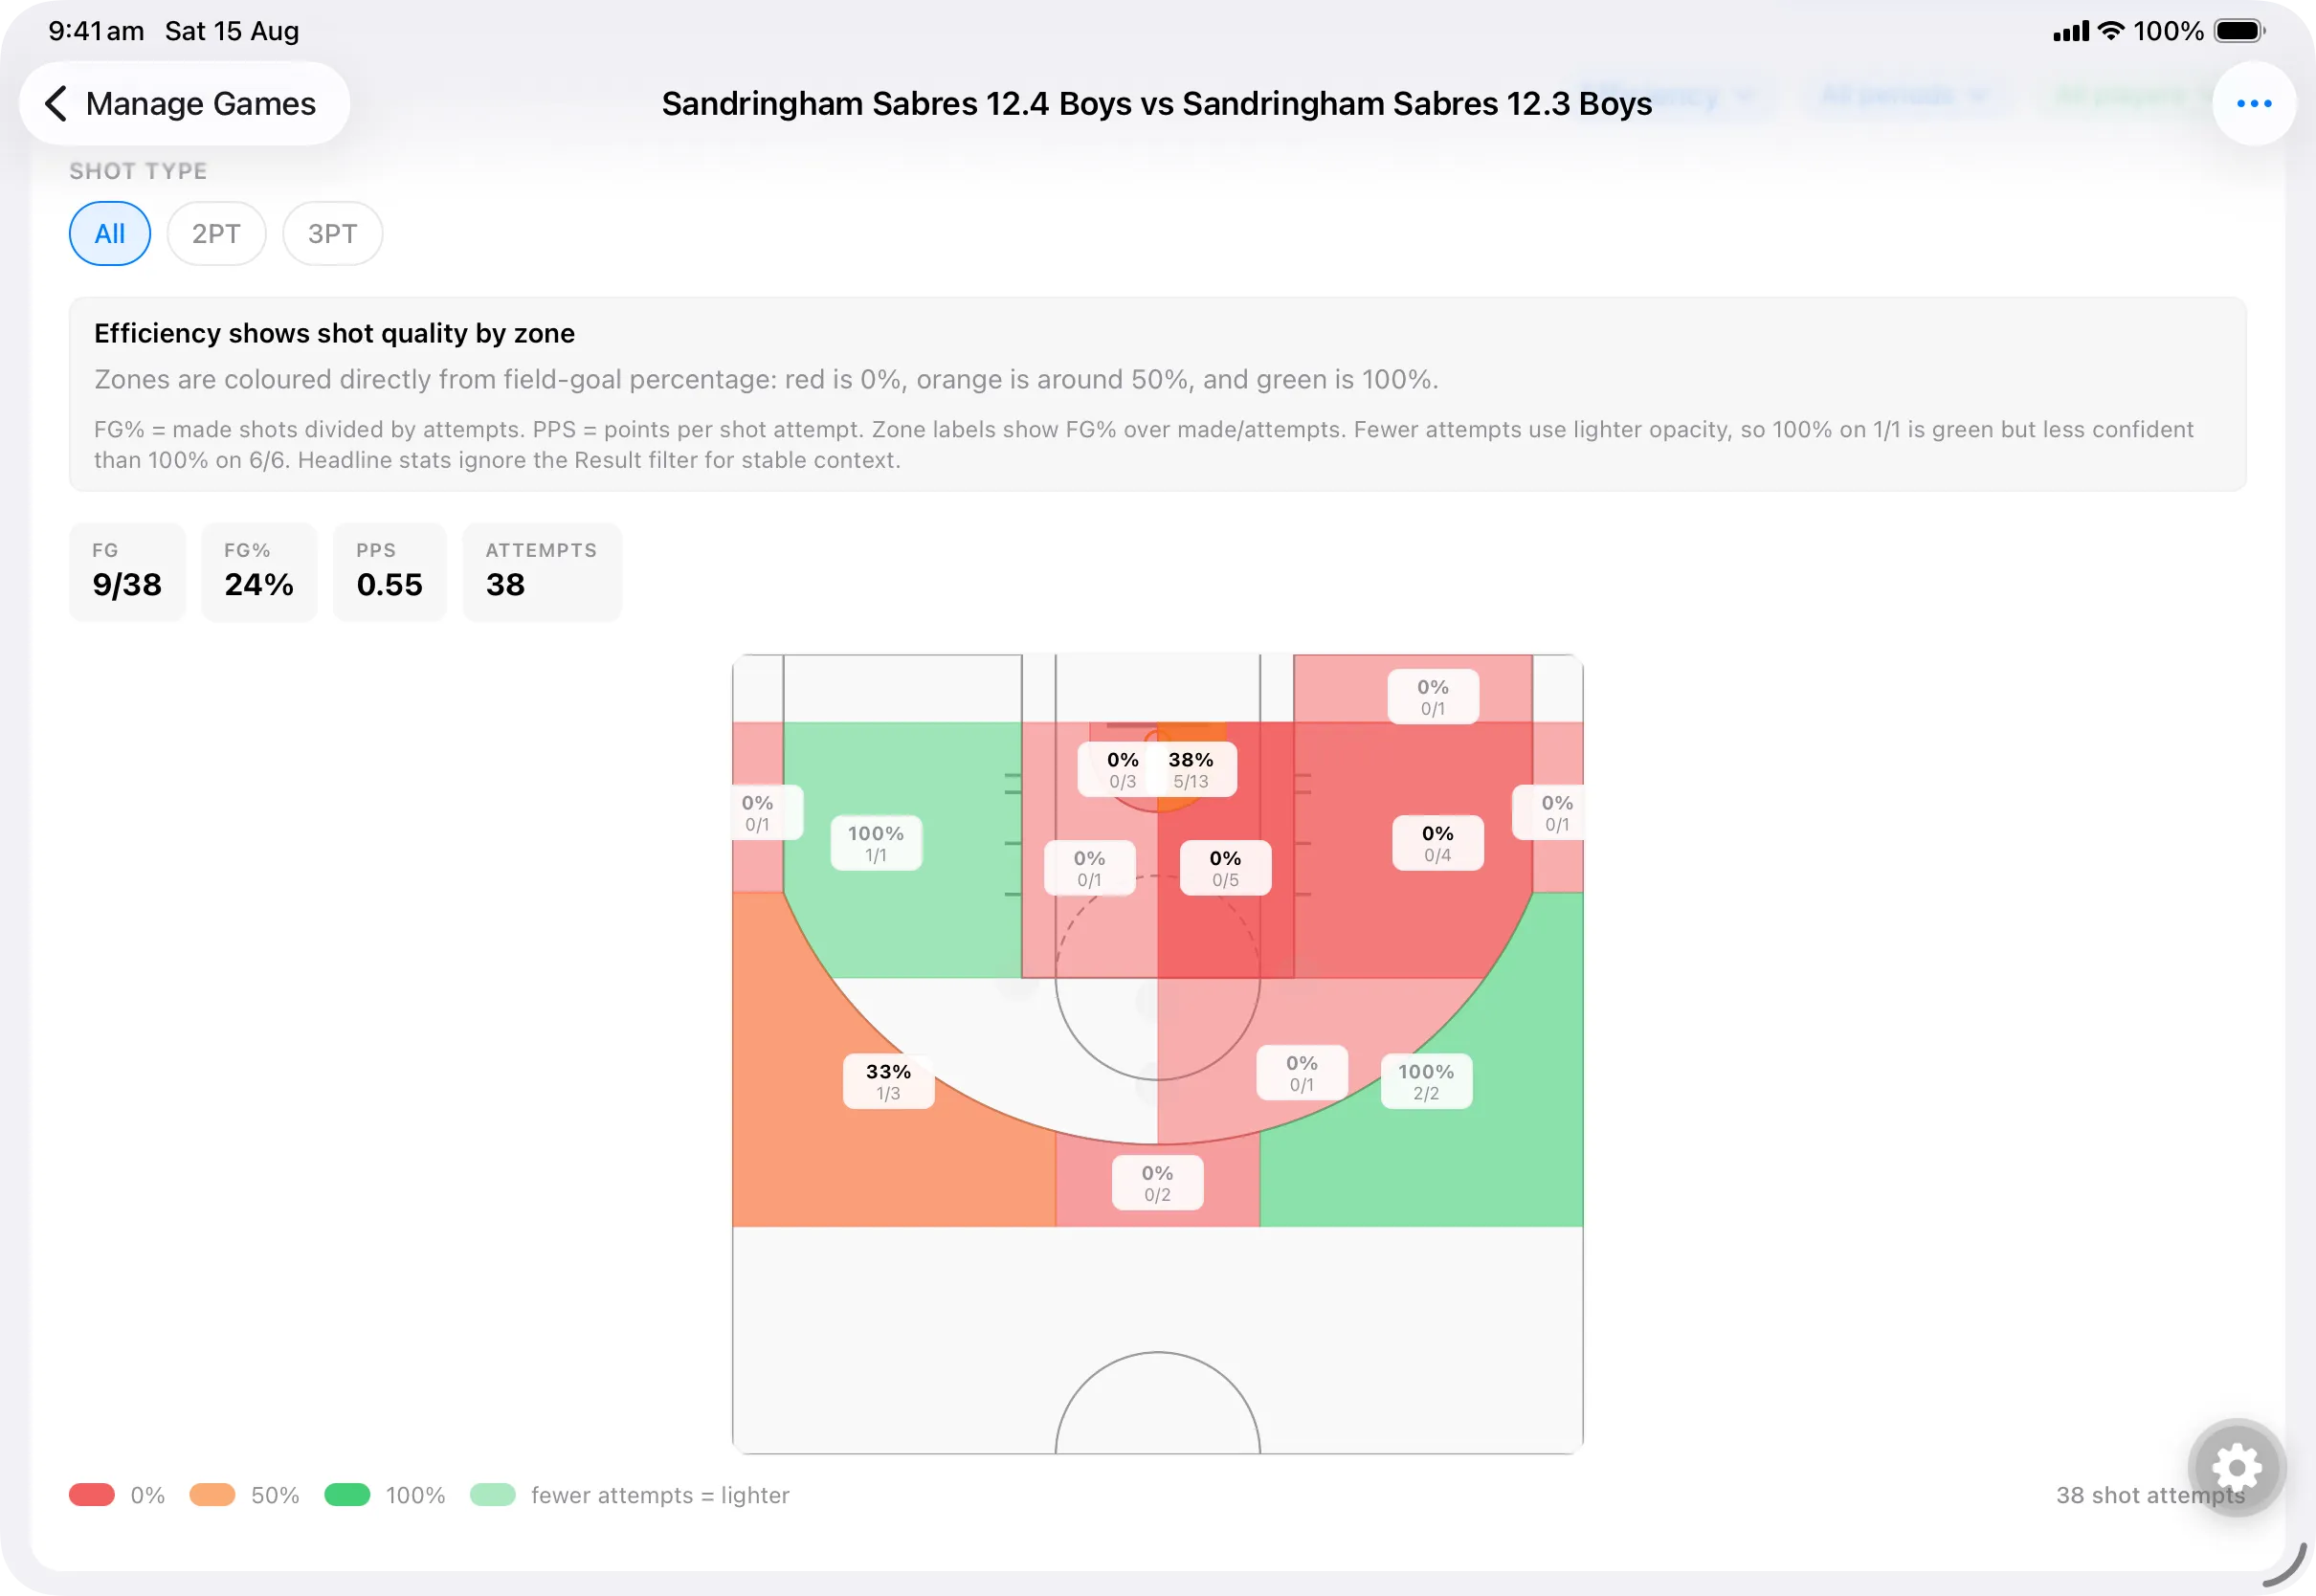
The Shot Analytics screen in Dunk Data for a game between two demo teams. Filters across the top select shot type All, 2PT or 3PT, alongside view, period and player filters. An explanatory panel describes how zones are coloured from field-goal percentage. Headline tiles show FG 9 of 38, FG% 24, PPS 0.55 and 38 attempts. Below, a half-court diagram is divided into zones coloured red through orange to green, each labelled with its field-goal percentage over makes and attempts, with lighter shading where there were fewer attempts. A legend maps red to 0 per cent, orange to 50 per cent and green to 100 per cent, and notes that fewer attempts render lighter.
The Shot Analytics efficiency view. Every zone prints its percentage and makes-of-attempts, so the read never depends on colour alone.

Player and team analytics

Develop the player behind the stat line

Follow how a player or team performs over time. Compare box-score stats, shot zones, effort, and ratings, then turn repeated patterns into coaching points.
  • Filter player and team analysis by date range and open any game for detail.
  • Follow a selectable progression chart across games.
  • Break down turnover and foul classifications by count, proportion, and court location.
  • Compare impact across different minute loads with Player Rating, Pressure Rating, and TVIR.
  • Support players who belong to multiple teams, each with their own jersey number.
How the advanced metrics work
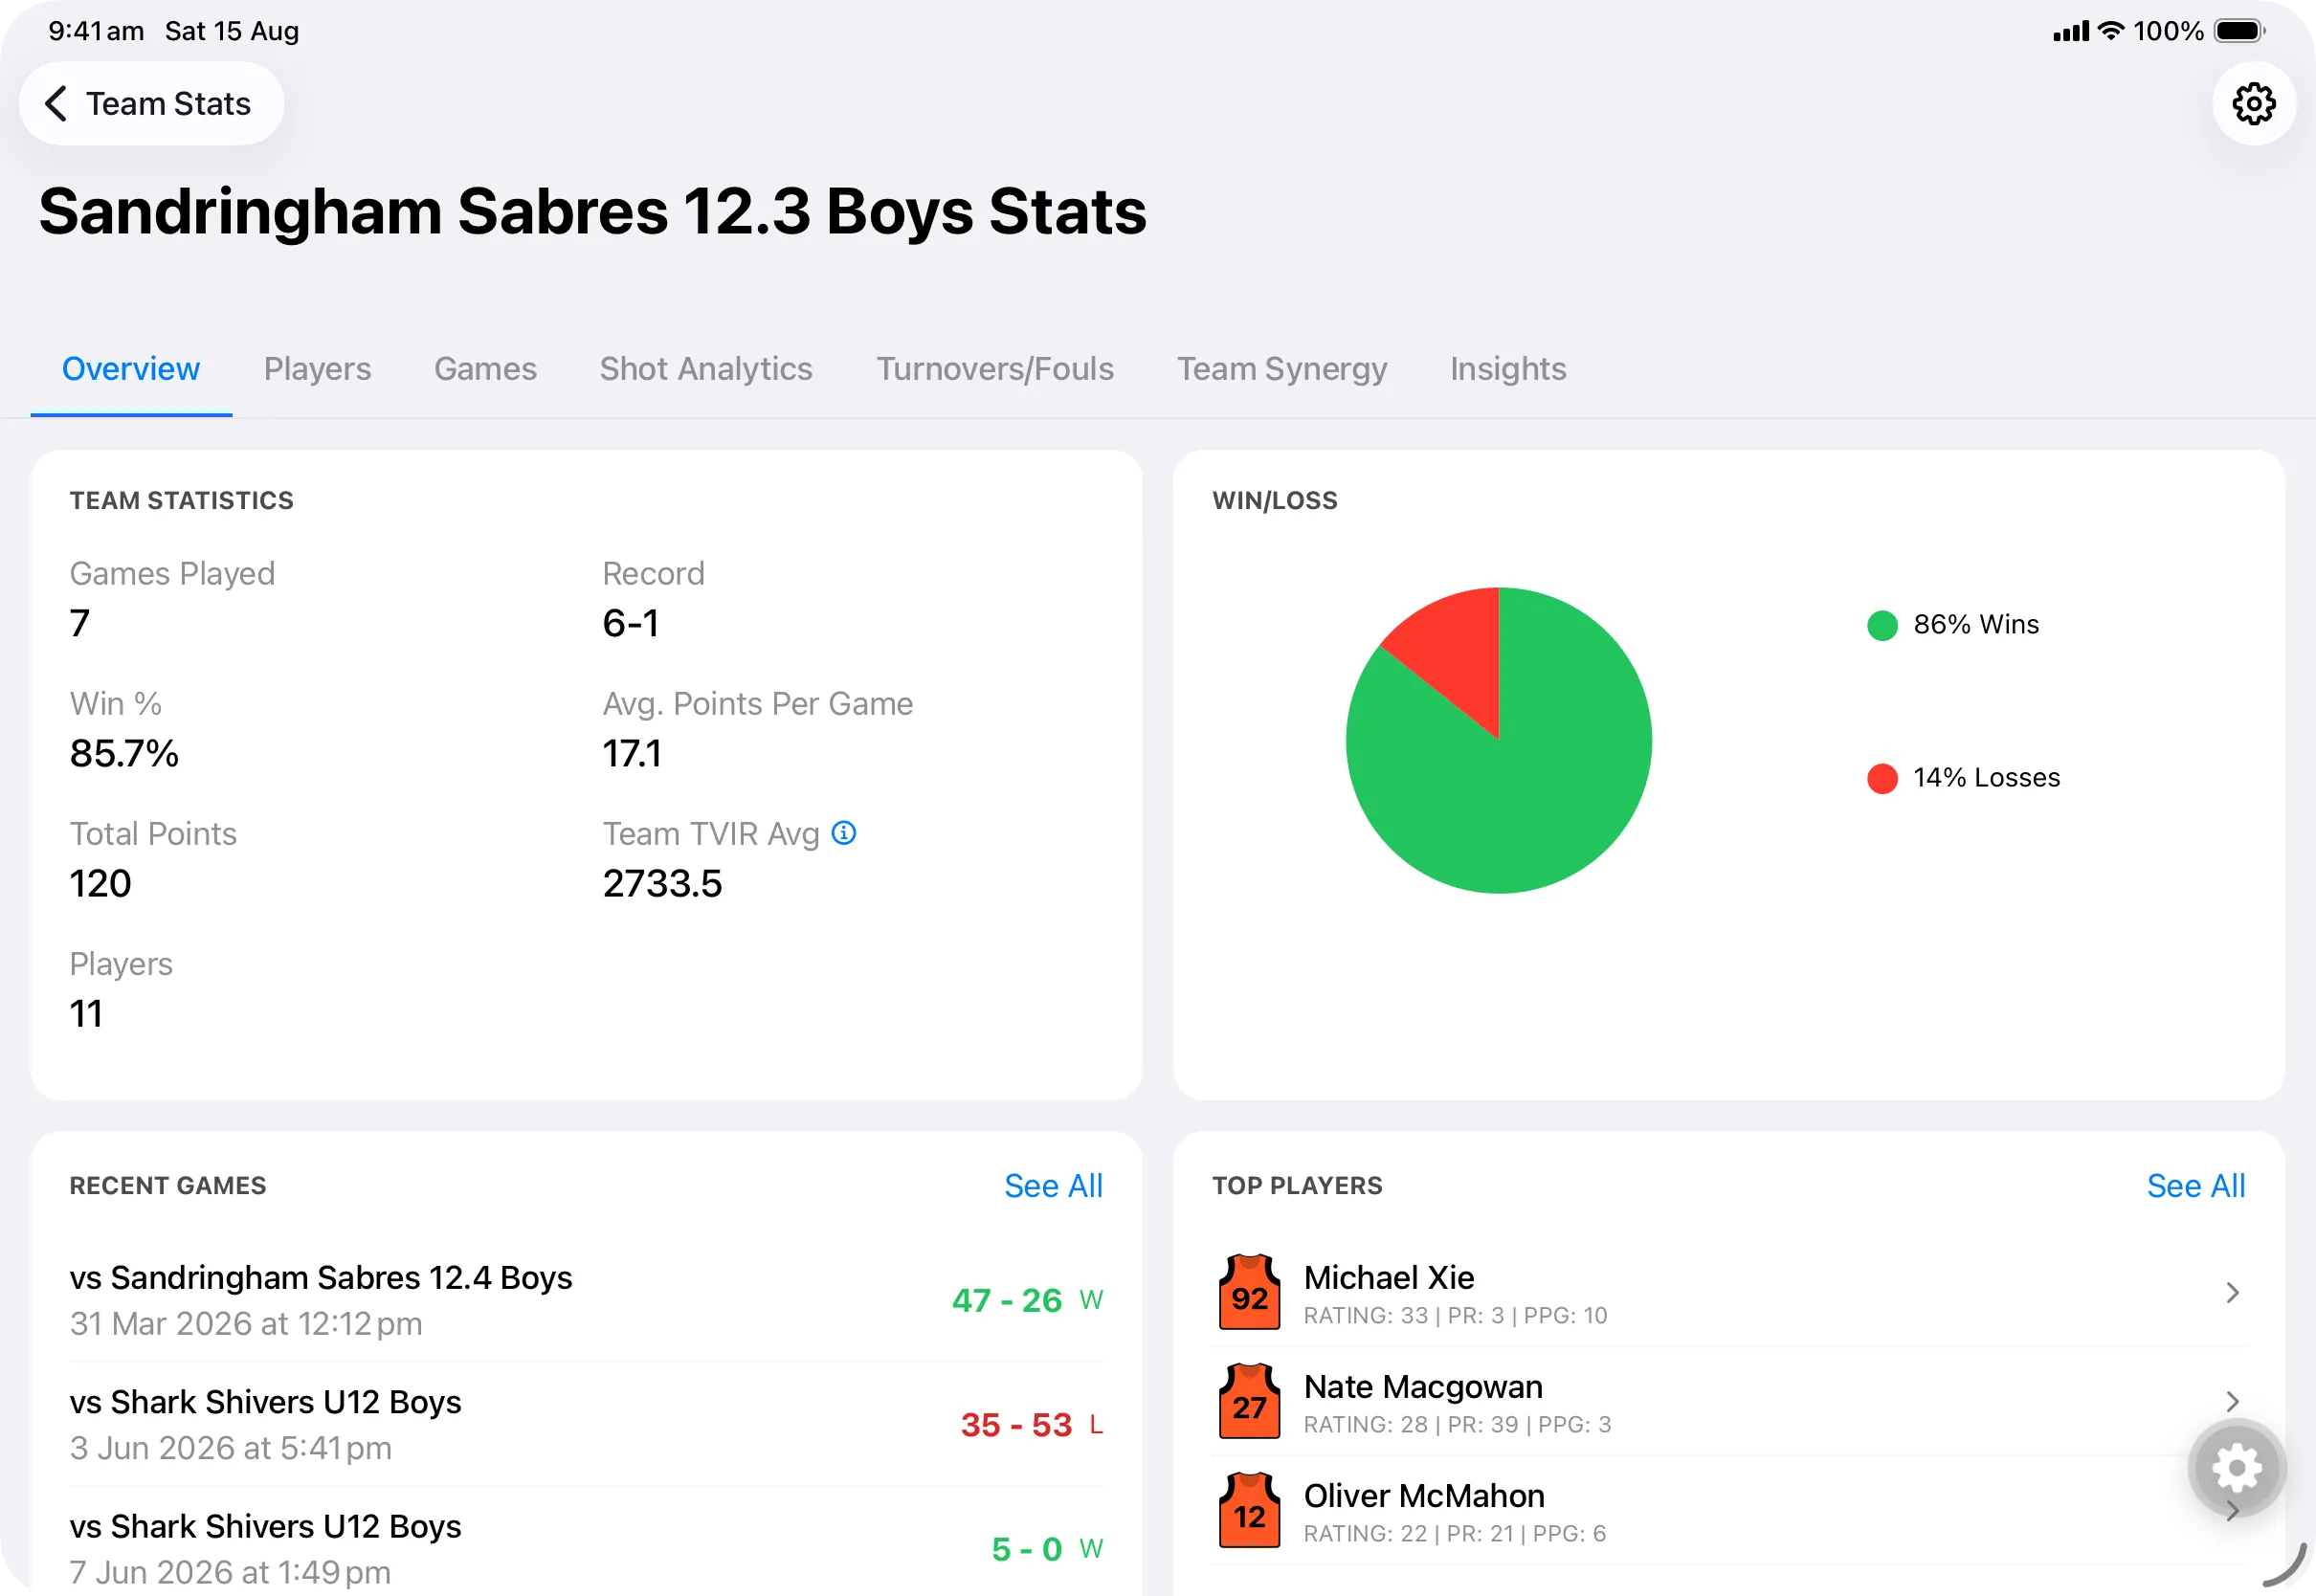
A team statistics screen in Dunk Data, headed “Sandringham Sabres 12.3 Boys Stats”, with tabs for Overview, Players, Games, Shot Analytics, Turnovers/Fouls, Team Synergy and Insights. Panels show team statistics including games played, record, win percentage, average points per game, total points and Team TVIR Average; a win/loss chart; a list of recent games with scores and results; and a top players list showing each player’s rating, Pressure Rating and points per game.
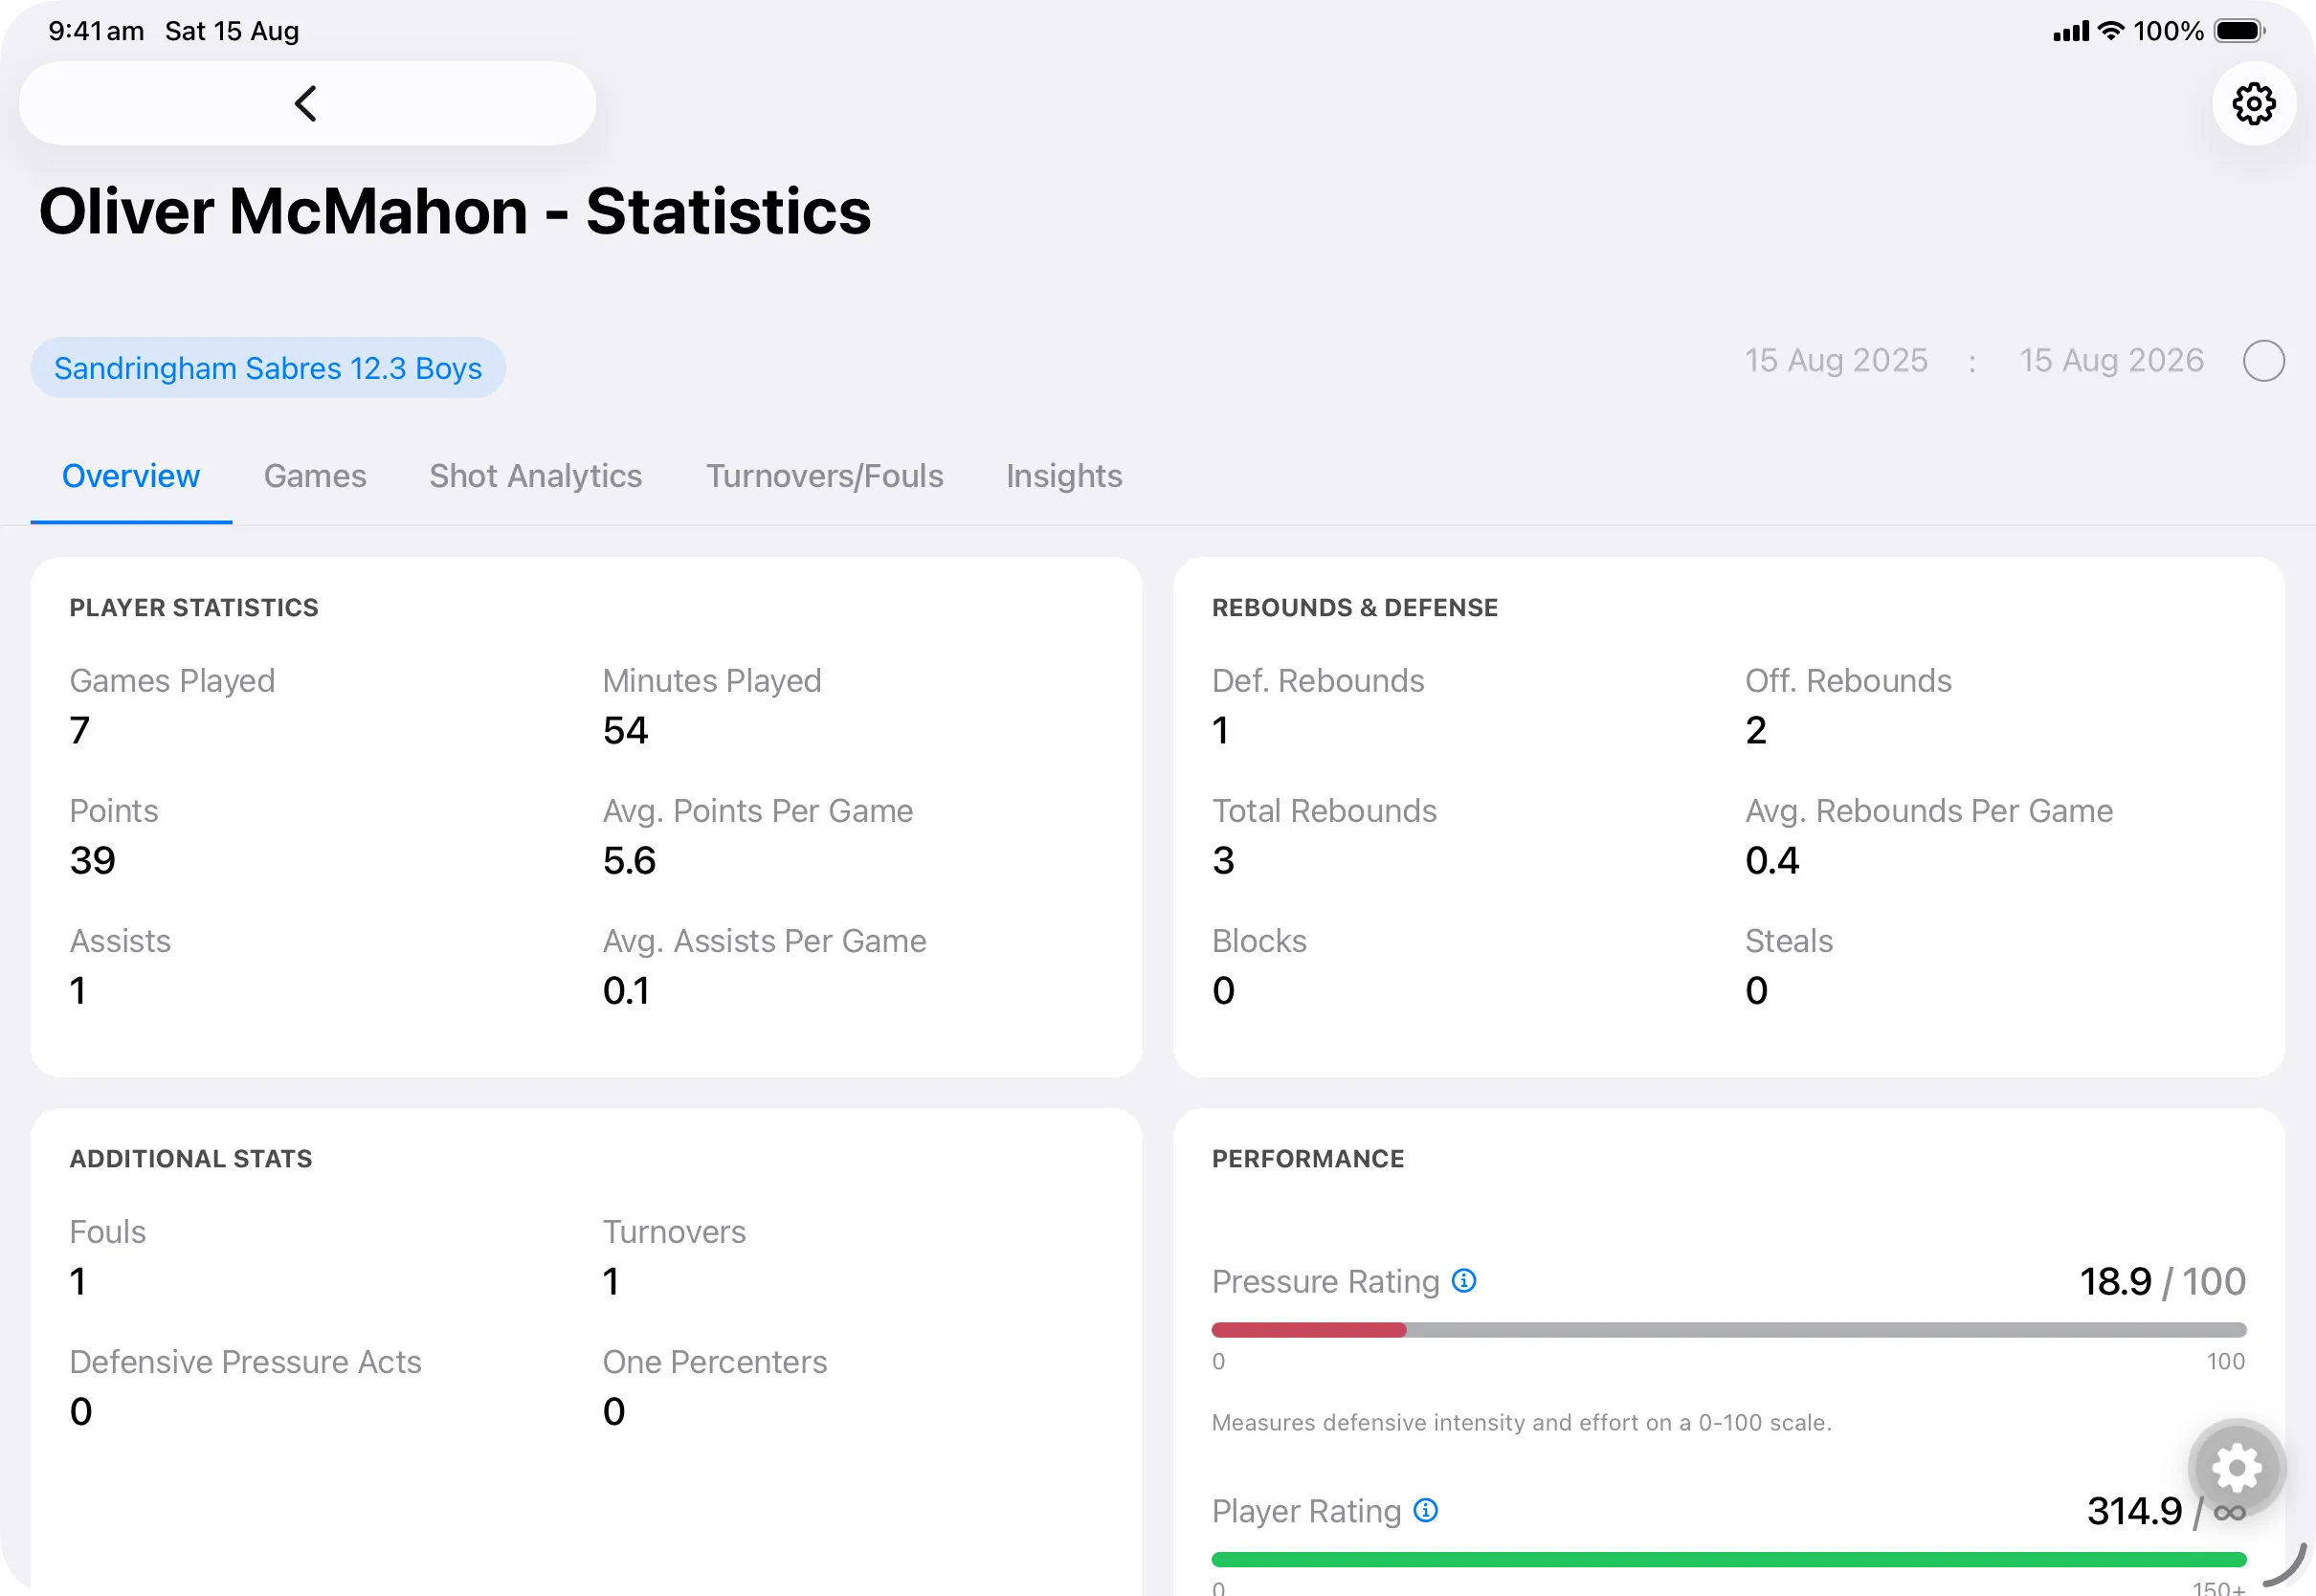
A player statistics screen in Dunk Data, headed “Oliver McMahon — Statistics”, with tabs for Overview, Games, Shot Analytics, Turnovers/Fouls and Insights, and a date-range filter. Panels show player statistics such as games played, minutes, points, averages and assists; rebounds and defence; additional stats including fouls, turnovers, Defensive Pressure Acts and one-percenters; and a performance panel with Pressure Rating and Player Rating shown on labelled scales.
The team Overview tab behind the player Overview tab, both filtered to a date range.

Team Synergy

Explore which starters fit together

Compare starting pairs, trios, groups of four, and full starting fives. See which combinations bring the best balance of shooting, defence, hustle, and plus-minus.

  • Rank groups found inside recorded starting lineups.
  • Read an Overall Score, Fit Score, player-quality context, starts together, and reliability.
  • Compare offensive shooting, defensive pressure, hustle, and winning fit against individual baselines.
  • See when a ranking is based on only a few shared starts.

Team Synergy estimates starter fit from recorded starts. Treat groups with few shared starts as an early guide.
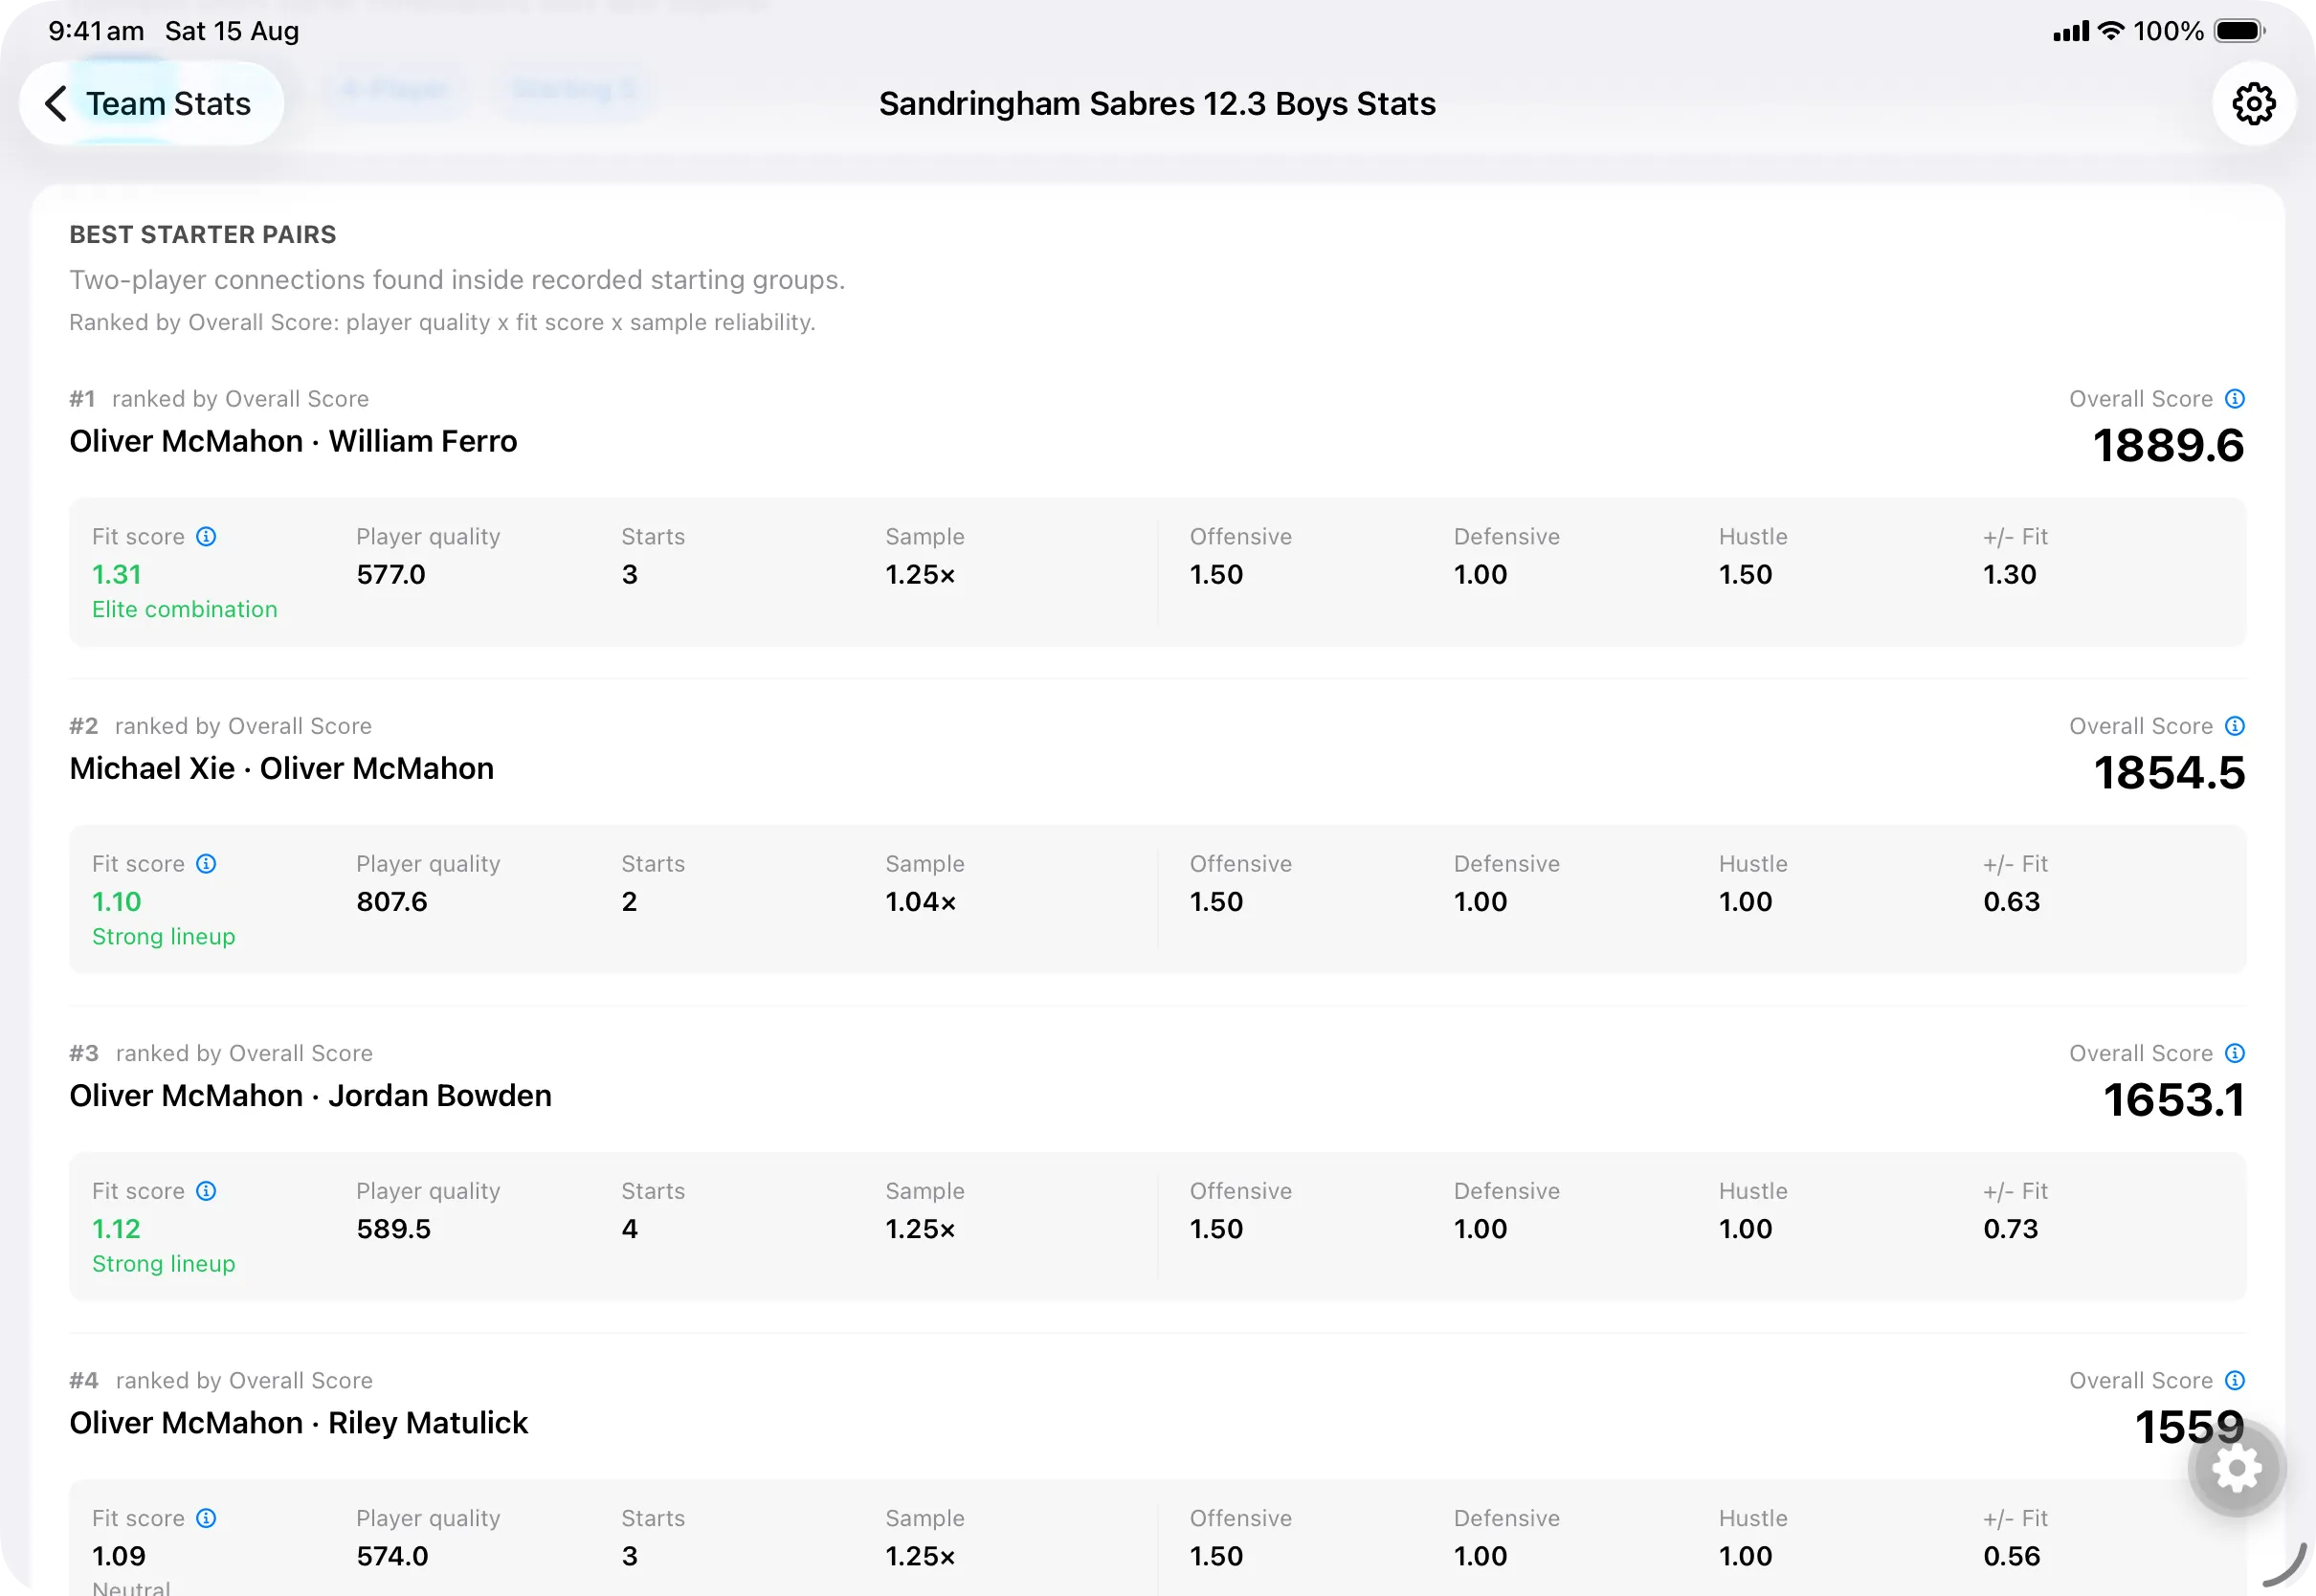
The Team Synergy screen in Dunk Data, headed “Sandringham Sabres 12.3 Boys Stats”, showing Best Starter Pairs. A note explains these are two-player connections found inside recorded starting groups, ranked by Overall Score of player quality times fit score times sample reliability. Each ranked pair lists the two players and an Overall Score, with a detail row showing Fit score and a plain-language label such as “Elite combination” or “Strong lineup”, plus player quality, starts, sample multiplier, and offensive, defensive, hustle and plus-minus fit values.
Best Starter Pairs, ranked by Overall Score with fit, starts and sample reliability shown for each group.

Coaching insights

Turn the recorded evidence into a plan

Turn your recorded stats into coaching points, practice priorities, and next-game goals.

AI-assisted insights

AI guidance grounded in your game data

Turn your recorded stats into a focused review of a game, player, or team. Each review highlights what is working, what needs attention, and what to do next.

What a generated read contains

  • Headline and game, player, or team read
  • Detected signals and swing factors
  • Strengths to keep leaning on
  • Development focus and priorities
  • Evidence drawn from recorded statistics
  • Notes when there is limited game data
  • Coaching cues and next-game actions

Training Guide

Go from game review to practice plan

Choose the games that best represent your team now. Dunk Data turns them into practice priorities, drills, coaching points, and targets for the next game.

What a generated guide contains

  • A weekly focus for the selected sample
  • Team strengths worth protecting
  • Prioritised improvement areas
  • Action steps for the coaching staff
  • Structured drills with durations and setup
  • Coaching points and target metrics
  • Next-game targets to measure against

AI generation needs a connection

You can record and review games offline. AI insights and Training Guides need an internet connection.

Advanced metrics

Understand what each rating means

Every rating includes a clear explanation, so you know what it measures and how to use it.

Read the metric methodology
TS%

True Shooting Percentage

Scoring efficiency across field goals and free throws.

TVIR

Team Value Impact Rating

Overall impact shown at a 40-minute rate.

Average TVIR

A player’s average 40-minute impact across selected games.

Season TVIR

A player’s total impact across the season.

Team TVIR Average

A team benchmark on the same scale as player TVIR.

PR

Pressure Rating

A 0–100 defensive-intensity and effort rating.

Player Rating

An all-in-one impact measure for a game or range.

Team Synergy Overall Score

A guide to the strongest starting combinations.

Team Synergy Fit Score

How well a starting group performs together.

Defensive Pressure Acts
Coach-recorded defensive actions that apply meaningful pressure without necessarily producing a steal or a block.
One-percenters
Coach-recorded effort or hustle plays that may not appear in a conventional box score.

Everything else

More tools for your season

Flexible game setup

Configure periods, timing, fouls, overtime, teams, venue, and recording depth.

Live lineups and minutes

Manage starters, substitutions, on-court status, minutes, and plus-minus.

Play History

Review, edit, or remove recorded events while totals remain aligned.

Shot Analytics

Compare zone efficiency and volume by team, player, period, shot value, and result.

Player development

Follow progression, ratings, shot patterns, and recurring mistakes across games.

Team patterns

Review record, trends, roster, shooting, classifications, and starter fit.

Training Guide

Create prioritised drills and next-game targets from a selected game sample.

Back up and export

Save a backup, restore your records, or export game stats when you need them elsewhere.

Your data. Your team.

Your game record stays in your control

Your teams, players, games, and recorded plays are saved on your device. Create a backup, restore your records, or export game stats whenever you need them.

  • Your records stay with you

    Your teams, players, games, and recorded plays are saved on your device.

  • Move your data when needed

    Create a backup, restore your records, or export game stats to use elsewhere.

  • AI insights need internet

    Recording and reviewing games work offline. You only need internet for AI insights and Training Guides.

FAQ

Common questions

Answers about recording games, reviewing stats, AI insights, and supported devices.

Who is Dunk Data for?

Dunk Data is designed for basketball coaches, assistant coaches, statisticians, and team staff who want to connect live game recording with practical player and team development.

Can I track individual players or just team totals?

Both. For each side of a game, you can choose individual-player statistics or team-only recording. This lets you match the level of detail to the roster and staff available.

What can I record during a game?

You can manage the score, clock, periods, fouls, starters, substitutions, minutes, and plus-minus while recording made and missed shots, free throws, points off turnovers, rebounds, assists, steals, blocks, turnovers, fouls, Defensive Pressure Acts, and one-percenters.

Does Dunk Data track shot locations?

Yes. Tap the shot location as you record it. You can then compare shooting by zone, team, player, period, shot value, or result.

What makes the turnover and foul analysis useful?

Dunk Data records why a turnover or foul happened, not only that it happened. This helps you spot repeated problems such as bad passes, carries, illegal screens, or reaching fouls.

What do the AI features do?

AI insights turn your recorded stats into game reviews, player feedback, coaching points, and practice ideas. They need an internet connection.

What is the Training Guide?

The Training Guide analyses the last three games, last five games, or all available games for a selected team. It identifies strengths and weak areas, then generates priority actions, structured drills, coaching points, target metrics, and next-game goals.

What is Team Synergy?

Team Synergy compares starting combinations using shooting, defensive pressure, hustle, plus-minus, and shared starts. It helps you explore which starters may fit well together.

Can I back up or export my data?

Yes. Your records are saved on your device. You can create a backup, restore your records, or export game stats to use elsewhere.

Does it work offline?

You can record and review games without internet. AI insights and Training Guides need a connection.

Which devices are supported?

Dunk Data is being built for iPhone, iPad, and Android devices. A full compatibility list will be available before release.

Better data. Better decisions. Better sessions.

Record the game, understand your team, and plan the next practice with Dunk Data.